Technical Analysis
- Go to tradingview.com
- Type BTC/USDT
Bull market Support Band
- Go to indicators
- Type Bull market Support Band

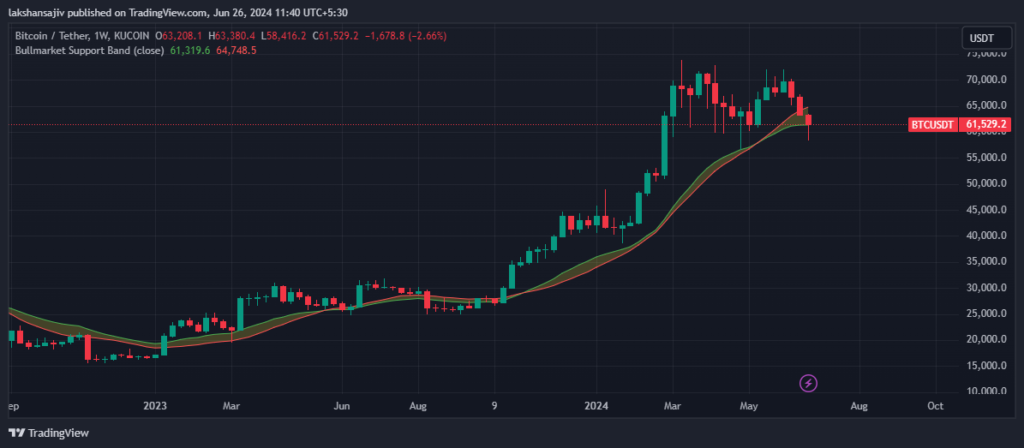
- We have placed the bull market support band on the 1-week (1W) chart for Bitcoin (BTC), and after 35 weeks, the BTC price has broken below this support band. This is not a good sign for traders looking for price appreciation.
- Over the past 35 weeks, the BTC price only touched the bull market support band once, and now it acts as resistance.
- This shift suggests a potential bearish trend and makes it more challenging for the BTC price to rise above this level, indicating potential difficulties ahead for bullish traders.
Relative Strength Index (RSI)
- Goto indicators
- Type Relative Strength Index

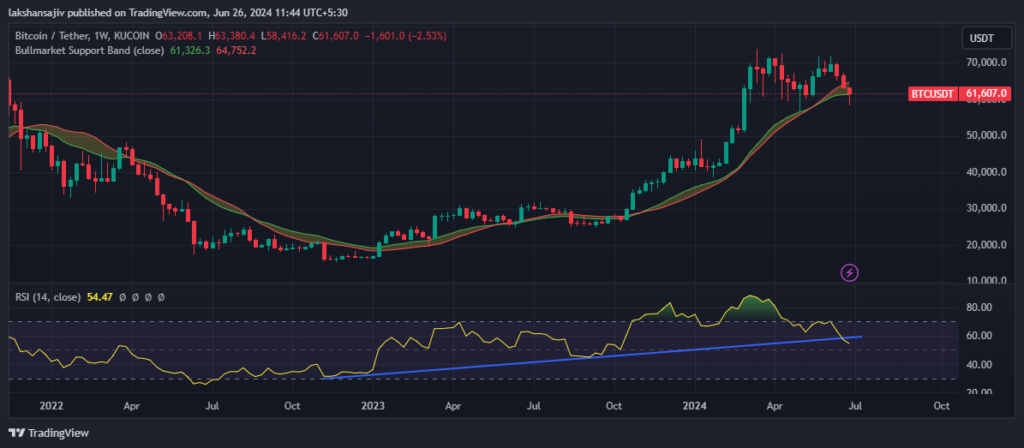
- The Relative Strength Index (RSI) is an indicator that provides early signals about whether the BTC chart is bullish or bearish. On the 1-week (1W) chart, we’ve applied the RSI indicator and drawn a trendline on it.
- Over the past 1.5 years, this trendline has acted as a support line, but it is now breaking apart. This break also signals potential bearish sentiment.
- However, since this is a weekly chart, we need to wait a couple of weeks to confirm this behavior and better understand the market’s direction.
Volume
- Goto indicators
- Type volume

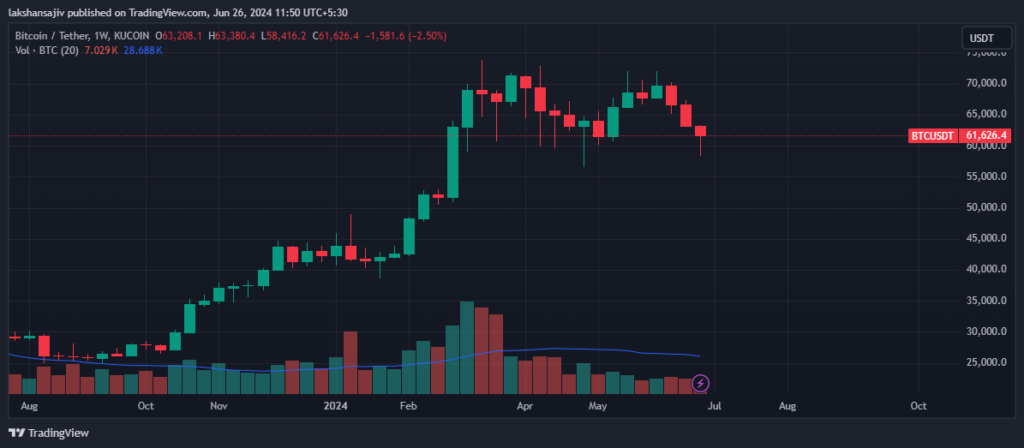
- Volume is indeed a crucial indicator in analyzing market sentiment and investor interest in Bitcoin (BTC). High and increasing volumes typically suggest strong institutional or retail interest, often indicating bullish sentiment as more participants enter the market.
- Conversely, declining volumes, as observed over the past couple of months in the BTC chart, signify waning investor activity and reduced confidence in the asset. This decrease in volume can signal a bearish movement, indicating that investors may be hesitant to invest in Bitcoin at current levels.
- Monitoring volume trends alongside price movements provides valuable insights into market dynamics and can help traders anticipate potential shifts in sentiment and trend directions.
Fibonacci Retracement
- You can find the Fibonacci Retracement tool on the left side of the interface.

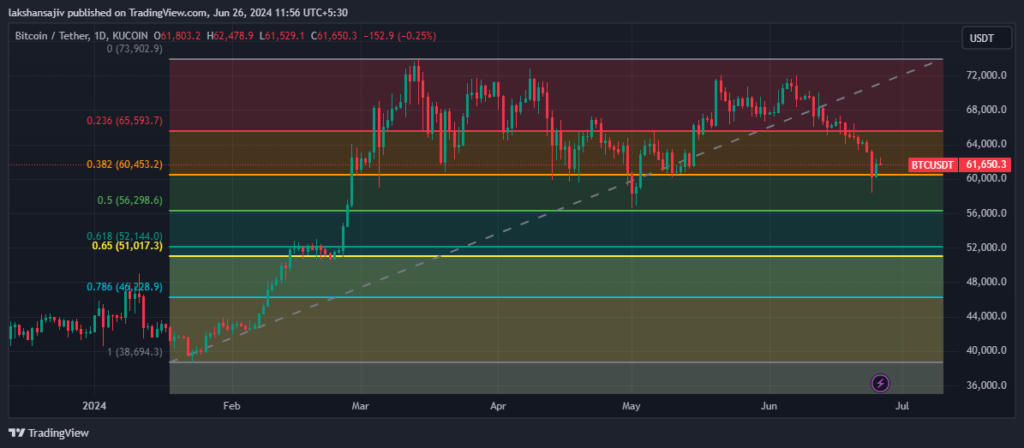
- Based on the analysis using the Fibonacci retracement tool on the 1-day (1D) chart, we’ve identified $56,000 and $51,000 as key support levels for the BTC price.
- Given the bearish signals from earlier indicators, there’s a likelihood that the BTC price could decline toward the $56,000 level.
- If this support at $56,000 breaks, the next significant support level is around $51,000. However, breaking below $51,000 could indicate a more substantial correction in the BTC price.
As of now, the data suggests that Bitcoin may find strong support below the $60,000 mark. Future articles will delve into fundamental analysis to provide further insights into the market dynamics and potential price movements. It’s crucial to monitor these technical and fundamental factors to navigate the current market conditions effectively.


